Fuel Price Report: Diesel Climbs to $6.28 as Gasoline Slips to $4.42
Diesel rose 9.7 cents on the week and now costs $2.66 more than a year ago, while gasoline fell 4.7 cents. Fleets that budgeted on this year's $5.10 average are paying about $1.18 a gallon over it with 10 weeks left in the calendar year.
Retail prices as of Oct. 19 · Wholesale and crude as of Oct. 14 · Alternative fuels for April 2026 · EIA outlook released Oct. 6
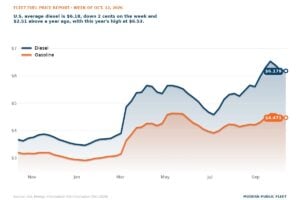
- Diesel: The national average rose 9.7 cents to $6.28 a gallon, $2.66 above a year ago and $1.18 above this year’s average of $5.10. It is 25 cents below the year’s high of $6.53.
- Gasoline: Down 4.7 cents to $4.42, still $1.27 above a year ago. Diesel costs $1.85 more than gasoline.
- Regions: California diesel is $8.24, up 15 cents, and the Lower Atlantic is $5.74, a $2.50 range across the country. Gasoline fell in every region except the Midwest, which was unchanged, and the Rocky Mountain states, where it rose.
- Bulk buyers: New York Harbor wholesale diesel was $5.07 on Oct. 14, up 6.9 cents. The pump sits $1.21 above it, which is where taxes, delivery and retail margin sit.
- CNG and propane: In DOE’s April report, CNG cost $3.48 per diesel-gallon equivalent against $5.55 for diesel in that same report, and propane was $5.53, near level with diesel on an energy basis. Those are April figures, not this week’s.
- Why: EIA said East Coast diesel stockpiles ran 32% below their five-year average in September, with higher crude prices and wider refiner margins on top.
Diesel averaged $6.276 a gallon in the week ending Oct. 19, up 9.7 cents, EIA said. Gasoline averaged $4.424 across all grades, down 4.7 cents; regular averaged $4.284. Diesel is $2.66 above where it was a year ago, a rise of 73%, and it costs $1.85 more than gasoline. It sits 25 cents below this year’s high of $6.53 and $1.18 above the year-to-date average of $5.10, with 10 weeks left in the calendar year.
EIA’s Short-Term Energy Outlook, released Oct. 6, said pump prices rose sharply in September, driven by higher crude oil prices and by wider crack spreads, the margin a refiner earns between what it pays for crude and what it sells fuel for. Diesel averaged $6.29 a gallon in September in that report and gasoline $4.35. EIA expects retail diesel to average about $4.50 a gallon next year and gasoline just under $3.60.
Why it is diesel that hurts
The squeeze is in the fuel itself. EIA said East Coast inventories of distillate, the family of fuels that includes diesel and heating oil, fell 32% below their five-year seasonal average in September. The agency expects them to stay about 20% below the 2021 to 2025 average through this winter and to come close to normal only in the second half of next year. Weekly stock and refinery figures now sit on EIA’s weekly petroleum supply pages, because the agency discontinued the Weekly Petroleum Status Report highlights PDF on Sept. 23.
Brent crude, the world oil price that U.S. fuel prices follow, was $126.55 a barrel on Oct. 14, up 55 cents on the week. EIA raised its forecast and now expects Brent to average $105 a barrel this quarter, $14 above last month’s figure, then $84 next year. The outlook assumes Middle East oil flows stay constrained through the fourth quarter, and it said tight diesel markets are themselves lifting crude demand, because refiners buy more crude to make diesel.
If your fuel line was built on this year’s average, re-check the last 10 weeks of the calendar. Diesel at $6.28 is $1.18 above the $5.10 average for the year so far. At that gap, every 10,000 gallons bought between now and year end costs about $11,800 more than an average-price assumption, which is 10,000 multiplied by $1.18.
If you can move light-duty work between diesel and gasoline units, the spread is $1.85 a gallon. Diesel rose 9.7 cents this week while gasoline fell 4.7 cents. The trade-off is vehicle availability and crew time, and the gasoline advantage is larger in California, where diesel at $8.24 runs $2.09 above gasoline at $6.15, against $1.85 nationally.
Where it hurts most
Diesel rose in every region EIA reports. California is highest at $8.24, up 15 cents. The West Coast excluding California had the week’s biggest increase, up 16 cents to $6.66. The Central Atlantic states are $6.51, up 4 cents, and New England $6.47, up 3 cents. The Rocky Mountain states are $6.42, up 12 cents, and the Midwest $6.35, up 9 cents. The Gulf Coast is $5.90 and the Lower Atlantic $5.74, both up about 9 cents. The range from California to the Lower Atlantic is $2.50 a gallon.
Gasoline went the other way almost everywhere. California fell 7 cents to $6.15 and the Gulf Coast fell 7 cents to $3.89, the cheapest region. The Lower Atlantic is $3.97 and the Midwest was unchanged at $4.24. Only the Rocky Mountain states rose, up 3 cents to $4.61.
What bulk buyers are paying
Wholesale diesel at New York Harbor, the spot market where cargoes trade for immediate delivery, was $5.07 a gallon on Oct. 14, up 6.9 cents, EIA said. The pump average sits $1.21 above that. The gap covers federal and state taxes, trucking from the terminal and the retailer’s margin, so a fleet loading at the rack, the terminal where tanker trucks fill, on a fixed differential over the spot price avoids the retail margin but not the taxes or the haul. Propane supply contracts are often tied to the Mont Belvieu wholesale benchmark, which was $1.07 a gallon on Oct. 14.
If you have tank capacity and a contract priced off wholesale, the $1.21 pump-to-wholesale gap is where the saving sits. Wholesale was $5.07 on Oct. 14 against $6.28 at the pump. Taxes and delivery come out of that gap, so the real saving is smaller. The trade-off is that filling storage now locks in today’s level, and EIA forecasts retail diesel averaging about $4.50 a gallon next year.
If you buy a share of your fuel on cards, re-run the bulk math before winter. Card fuel pays the full retail price, which rose 9.7 cents this week while wholesale rose 6.9 cents. Worth checking your card gallons against the minimum volume your rack contract requires.
The trend: 3, 6 and 9 months
Diesel is up 22% over three months, 16% over six, 78% over nine and 71% over 12. The six-month figure being smaller than the three-month one shows prices dipped in the spring and have climbed since. Gasoline is up 7% over three months and 39% over 12, a much gentler path. Wholesale diesel at New York Harbor is up 27% in three months and 125% in 12, well ahead of the retail rise. Brent crude is up 101% over 12 months. This week’s 9.7-cent rise is small set against the largest weekly rise of the past 52 weeks, 96.2 cents.
CNG, propane and the other fuels
DOE’s Alternative Fuel Price Report for April 2026 is the most recent, and its figures are compared here only with the diesel and gasoline in that same report. Per diesel-gallon equivalent, which adjusts for energy content, CNG was $3.48 against diesel at $5.55, a gap of $2.07. Propane was $5.53, two cents under diesel, so at retail propane sits near diesel on an energy basis and a fleet’s saving comes from its bulk supply contract. LNG was $4.81. B20 was $5.41 and B99/B100 $5.80 against that $5.55 diesel. E85 was $4.86 against gasoline’s $4.63.
If you run CNG, price your own delivered cost against DOE’s April benchmark. In DOE’s April report CNG averaged $3.48 per diesel-gallon equivalent nationally, from $3.02 in the Lower Atlantic to $4.55 in New England, against diesel at $5.55 in that same report. Those are April figures, so the useful check is your station’s cost per diesel-gallon equivalent this month.
If you already run propane, the contract is worth pricing, not the public pump. In DOE’s April report propane was $5.53 per diesel-gallon equivalent against diesel at $5.55 in that report, close to parity at retail. Worth asking your supplier how your differential over the wholesale benchmark is set and what volume commitment it requires.
What to watch this week, and what it tells you
-
Every weekdayEIA’s New York Harbor spot price for diesel
It was $5.07 on Oct. 14, up 6.9 cents on the week. Rack prices follow within days, so a sustained move there tells you what the next delivered load will cost.
-
MondayEIA’s weekly retail prices for diesel and gasoline
Watch whether diesel adds to this week’s 9.7-cent rise or stalls below the year’s high of $6.53, and whether gasoline keeps falling.
-
WednesdayEIA’s Weekly Petroleum Status Report
The highlights PDF was discontinued Sept. 23, so the data now sit on EIA’s weekly petroleum supply pages. East Coast diesel-type stockpiles are the number to follow after September’s 32% shortfall against the five-year average.
-
Nov. 10EIA’s next Short-Term Energy Outlook
The Oct. 6 edition put retail diesel at about $4.50 a gallon for next year and Brent at $105 a barrel this quarter. Another increase to those would point to the squeeze running into 2027.
Glossary: how to read fuel prices
This note runs with every Fleet Fuel Price Report because these prices measure different things, and a buying decision made off the wrong one is expensive.
- Retail
- The pump price. EIA surveys stations every Monday. It includes federal and state taxes, freight to the station and the retailer’s margin, and it lags the wholesale market by one to two weeks. It is what a fleet pays on a fuel card, and it is the number most news reports quote.
- Wholesale, or spot
- Today’s price for a large lot of fuel at a trading hub: New York Harbor, the Gulf Coast or Los Angeles. EIA publishes it every business day. Rack prices and most supply contracts are set off it, and it is the earliest public signal of where the pump is heading.
- Futures
- A price agreed today for delivery in a future month, traded on the New York Mercantile Exchange. The nearest month tracks spot. The useful part is the shape of the curve: when later months are cheaper than the front month, the market expects today’s tightness to ease; when later months cost more, it expects the opposite. A fleet does not buy futures, but a fixed-price or capped supply contract is priced off them, so the curve is what your supplier is looking at when it quotes one. Futures settlements are published by CME Group and are not free to republish, which is why they are described here rather than charted.
- Bulk
- What a fleet pays a supplier for delivery to its own tanks. It is usually a published rack price, most often OPIS, plus or minus a differential and freight, or spot plus a differential. It excludes station margin, and for state and local governments it usually excludes the 24.4-cent federal excise tax on diesel and the 18.4-cent tax on gasoline, along with state fuel tax where the state exempts government use. Rack prices are proprietary, so there is no public bulk series. The gap between spot and retail is the closest public measure of what a bulk buyer avoids.
- Brent crude
- The price of a barrel of oil from the North Sea, used worldwide as the reference price for crude. Diesel and gasoline are made from crude, so when Brent moves, wholesale fuel follows within days and the pump within weeks. It is quoted in dollars per barrel; a barrel is 42 gallons.
- Energy-equivalent prices
- A gallon of propane, E85 or CNG does not hold a gallon of diesel’s energy, so DOE also states alternative fuel prices per gasoline-gallon equivalent (GGE) and per diesel-gallon equivalent (DGE). That is the price of the same amount of work, and it is the only fair way to compare a CNG or propane quote with a diesel one. The alternative fuels chart in this report uses it.
- What it means for buyers
- Watch spot for direction: a rising spot price this week is a higher pump price next week, and vice versa. Use the curve for planning: when later months are much cheaper, locking in long at today’s price is expensive insurance; when the curve is flat or rising, a fixed-price contract costs less to get. And judge any supplier quote against spot plus freight, never against the pump.
Source: U.S. Energy Information Administration (Oct 2026), Gasoline and Diesel Fuel Update, Spot Prices, Weekly Petroleum Status Report and Short-Term Energy Outlook; U.S. Department of Energy, Alternative Fuel Price Report (April 2026); IRS Publication 510. EIA and DOE data are U.S. government works in the public domain. Charts by Modern Public Fleet from those sources.