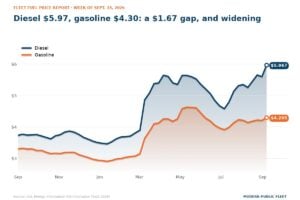
Fuel Price Report: Diesel Hits $6.53, the Year’s High, as Wholesale Jumps 69 Cents
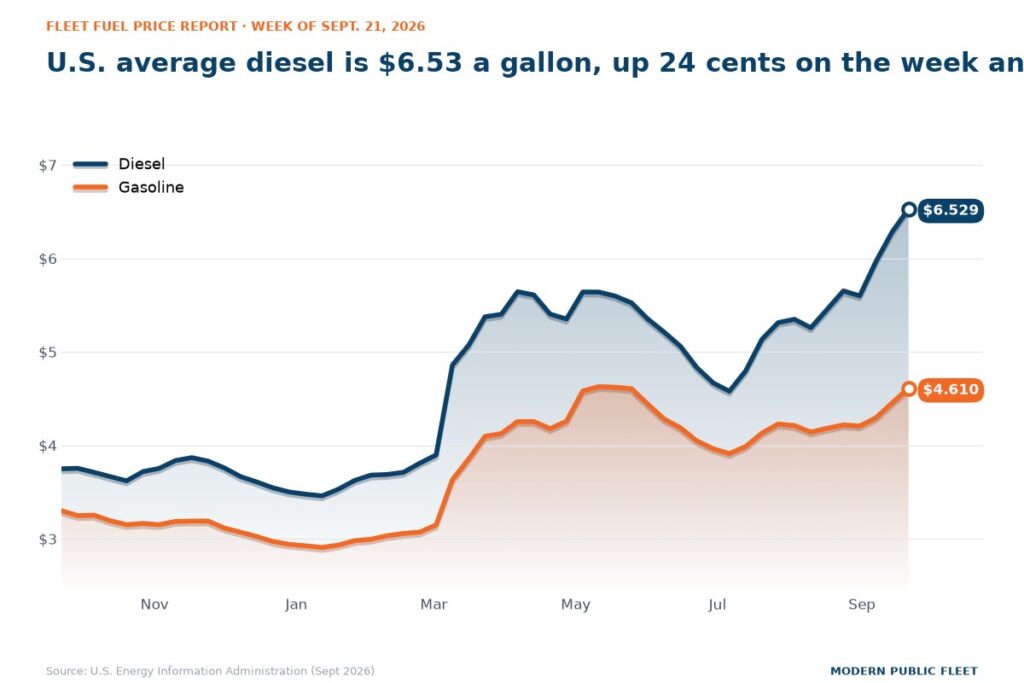
Diesel averaged $6.53 a gallon, the highest price of 2026 and $1.92 above gasoline. EIA said the national diesel stockpile is 13% below its five-year average, and wholesale prices are still climbing faster than the pump.
 1 / 6
1 / 6
Retail prices as of Sept. 21 · wholesale as of Sept. 15 · inventories for the week ending Sept. 11 · alternative fuels for April 2026
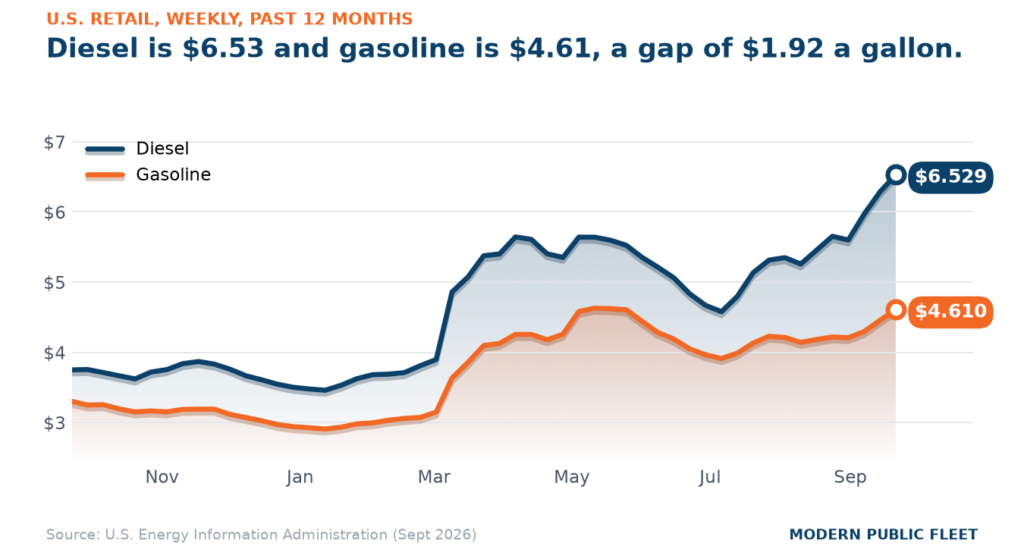
- Diesel: The U.S. average is $6.53 a gallon, up 24 cents in a week. It is the highest price of 2026 and 74% above a year ago.
- Gasoline: $4.61, up 16 cents on the week and $1.31 above a year ago. Diesel now costs $1.92 more per gallon than gasoline.
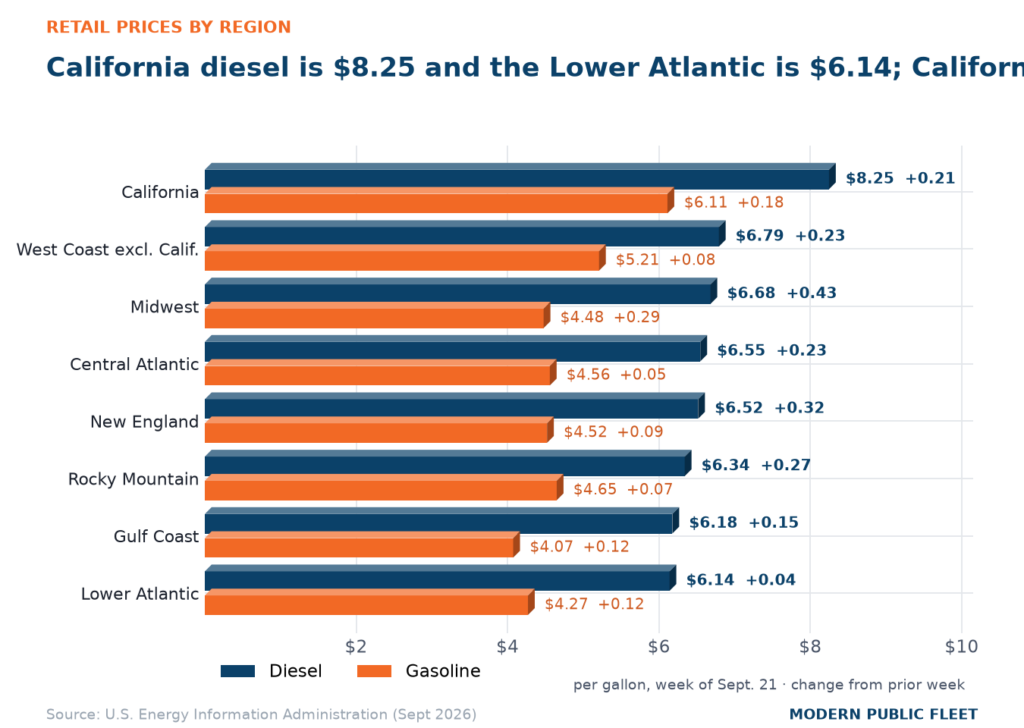
- Regions: California diesel is $8.25 and the Lower Atlantic is $6.14, a $2.11 spread. The Midwest moved most, up 43 cents on diesel in one week.
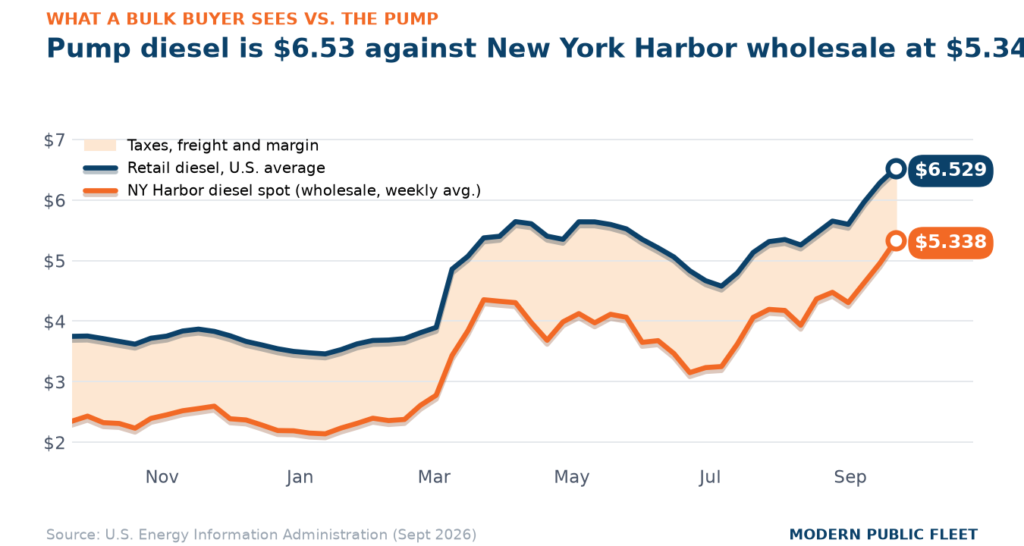
- Bulk buyers: New York Harbor wholesale diesel is $5.34, up 69 cents in a week, nearly three times the pump’s move. The pump sits $1.19 above wholesale.
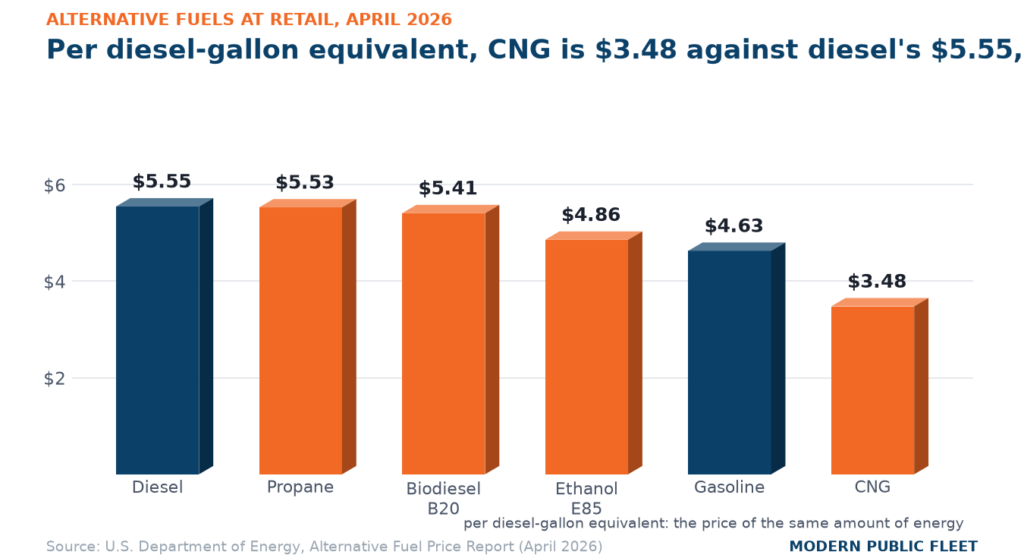
- CNG and propane: Per diesel-gallon equivalent, CNG averaged $3.48 against diesel’s $5.55 in DOE’s April report. Propane at $5.53 is within 2 cents of diesel.
- Why: EIA said the diesel stockpile is 13% below the five-year average and raised its 2026 retail diesel forecast to $5.07 a gallon from $4.85.
The U.S. average price of on-highway diesel reached $6.529 a gallon in the week ending Sept. 21, EIA said, up 24.4 cents from the week before and the highest price so far this year. A year ago the same gallon cost $3.749, so diesel is up $2.78, or 74%. Regular gasoline averaged $4.610, up 15.5 cents on the week and $1.31 above a year ago. Diesel costs $1.92 more than gasoline. The year-to-date average for diesel is $4.97, which means fleets are now paying $1.56 a gallon above the figure many of them budgeted against.
The cause is crude. Brent crude, the world oil price that U.S. fuel prices follow, was $130.80 a barrel on Sept. 15, up $24.68 in a week. In its Sept. 9 Short-Term Energy Outlook, EIA said oil prices are elevated because global oil inventories have fallen by an estimated 400 million barrels this year, and it expects them to keep falling through the end of 2026. That outlook was completed Sept. 3, before the latest run-up. It assumed Brent would average about $90 a barrel in the second half of the year.
Why it is diesel that hurts
Diesel comes out of the distillate pool, the refinery output that also makes heating oil. For the week ending Sept. 11, EIA said those inventories rose 1.6 million barrels but are still 13% below their five-year average. Gasoline inventories are 5% below. Refineries ran 17.3 million barrels a day, down 256,000 from the prior week, at 96.8% of capacity, which is close to flat out, and diesel output slipped to 5.2 million barrels a day. Demand is not the driver. The four-week average of diesel supplied to the market fell 3.3% from a year ago.
EIA forecasts that diesel inventories will drop below 100 million barrels in September and stay under the five-year low through much of 2027. It said tightness in the global diesel market has raised prices here and encouraged U.S. exporters to ship more abroad. In the Sept. 9 outlook EIA raised its 2026 retail diesel forecast to $5.07 a gallon from $4.85 and its 2027 forecast to $4.40 from $4.07. Both are full-year averages, so they sit below today’s pump. The forecast refiner margin on diesel, the gap between crude cost and diesel value, rose to $1.57 a gallon for 2026, up 21%.
If you budgeted at this year’s average, the gap is now $1.56 a gallon. EIA’s year-to-date diesel average is $4.97 and the Sept. 21 price is $6.53, a difference of $1.56. Fourteen weeks remain in the calendar year, so a fleet burning 10,000 gallons a week would buy 140,000 more gallons; at $1.56 above the budget assumption, that is about $218,000.
If a supplemental appropriation takes weeks to move in your jurisdiction, build the request on the forecast rather than the pump. EIA’s Sept. 9 outlook puts 2026 retail diesel at an average $5.07 and 2027 at $4.40, both raised from the August forecast, and both were completed before Brent reached $130.80. The trade-off is that EIA revises those numbers monthly, and the next revision lands Oct. 6.
Where it hurts most
On diesel, California is $8.25 a gallon, up 21 cents. The West Coast outside California is $6.79, up 23 cents. The Midwest is $6.68 after a 43-cent jump, the largest weekly move of any region. The Central Atlantic, the New York to Maryland corridor, is $6.55, up 23 cents. New England is $6.52, up 32 cents. The Rocky Mountain region is $6.34, up 27 cents. The Gulf Coast is $6.18, up 15 cents. The Lower Atlantic, Virginia through Florida, is $6.14, up 4 cents. California to the Lower Atlantic is a spread of $2.11 on the same fuel.
Gasoline runs in a similar order with smaller moves. California is $6.11, up 18 cents. The West Coast outside California is $5.21, up 8 cents. The Rocky Mountain region is $4.65, up 7 cents. The Central Atlantic is $4.56, up 5 cents. New England is $4.52, up 9 cents. The Midwest is $4.48, up 29 cents. The Lower Atlantic is $4.27 and the Gulf Coast $4.07, each up 12 cents. Midwest fleets took the worst of the week on both fuels. Lower Atlantic fleets barely felt it on diesel.
What bulk buyers are paying
Wholesale diesel at New York Harbor, the spot price, meaning the price for immediate delivery at the main East Coast trading hub, was $5.34 a gallon on Sept. 15, up 69 cents in a week. The pump average sits $1.19 above that. The gap covers federal and state taxes, trucking from the terminal to the station and the retailer’s margin. A fleet buying on a contract tied to the wholesale market, or loading at the local terminal, known as the rack, avoids much of that $1.19. It also absorbs the full 69-cent weekly swing at once, while retail moved 24 cents.
If your supply contract is priced off a wholesale index, the invoice moves before the pump does. New York Harbor diesel rose 69 cents in the week to Sept. 15 while the national pump average rose 24 cents. Index buyers take the larger move first. That is the trade they already accepted: a lower average price in exchange for more movement week to week.
If you buy a large share on fuel cards, it is worth checking that spend against the bulk math. Retail is running $1.19 above New York Harbor wholesale. For every 10,000 gallons a month bought at the pump rather than on a wholesale-indexed contract, that gap is $11,900 a month, or about $143,000 a year. The offsets are tank capacity, spill and inspection compliance and staff time.
The trend: 3, 6 and 9 months
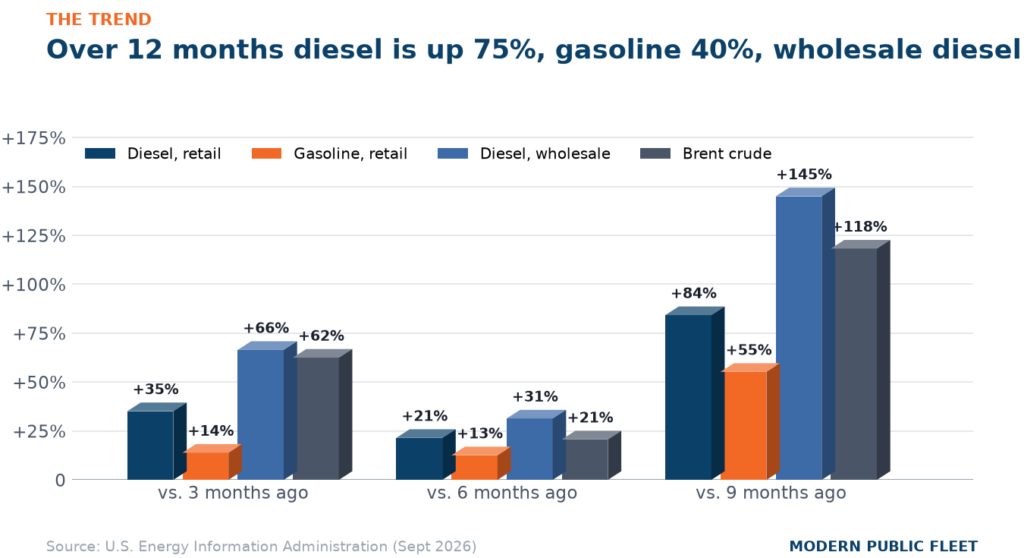
Diesel is up 35% over three months, 21% over six, 84% over nine and 75% over 12. The nine-month gain being larger than the 12-month gain means prices fell last autumn and then climbed well past where they started. Gasoline is up 14%, 13%, 55% and 40% on the same clocks. Wholesale ran further: New York Harbor diesel is up 66% in three months and 124% in a year. Brent is up 63% in three months and 93% in a year. This week’s 24-cent rise is about a quarter of the biggest weekly increase of the past 52 weeks, 96 cents.
CNG, propane and the other fuels
DOE’s Alternative Fuel Price Report for April 2026 prices fuels per diesel-gallon equivalent, the energy in one gallon of diesel. CNG averaged $3.48 against diesel’s $5.55 in the same report, a gap of $2.07, or 37%. For every 100,000 diesel-gallon equivalents, that gap is worth $207,000. LNG was $4.81. Propane was $5.53, two cents under diesel, so at retail the two are near parity on energy; propane’s saving sits in the supply contract, not the pump sign. Wholesale propane at Mont Belvieu was 85.5 cents a gallon Sept. 15. B20 was $5.41 and B99/B100 $5.80. E85 was $4.86 against gasoline’s $4.63.
If a CNG replacement decision was close last spring, the regional numbers have moved under it. In DOE’s April report, West Coast CNG was $3.73 per diesel-gallon equivalent against diesel at $7.16, a gap of $3.43. New England was the narrowest, $4.55 against $5.55, a gap of $1. The figures are five months old, and station and vehicle capital still has to clear the gap.
If you already run propane, look at the contract rather than the retail price. Retail propane was $5.53 per diesel-gallon equivalent in April, two cents under diesel’s $5.55. Wholesale propane at Mont Belvieu was 85.5 cents a gallon Sept. 15, and EIA said propane inventories are 22% above the five-year average, so supply is ample. Whether that reaches your tank depends on the terms you sign.
What to watch this week, and what it tells you
-
Every weekdayThe New York Harbor wholesale diesel price
It rose 69 cents this week against 24 cents at the pump. Wholesale leads retail, so a second week like that points to higher pump prices in early Oct.
-
Monday, 5 p.m. ETEIA’s weekly pump prices
Watch whether diesel prints above $6.53, which would set another 2026 high, and whether the Midwest repeats its 43-cent jump.
-
Wednesday, 10:30 a.m. ETEIA’s Weekly Petroleum Status Report
The diesel stockpile is 13% below the five-year average and EIA expects it under 100 million barrels this month. The report shows whether that happened and whether refinery runs held near 96.8% of capacity.
-
Oct. 6EIA’s next Short-Term Energy Outlook
The September edition was completed Sept. 3, when it assumed Brent near $90 a barrel for the second half of 2026. Brent was $130.80 on Sept. 15, so the $5.07 diesel forecast for 2026 may go up. EIA’s Winter Fuels Outlook follows Oct. 15.
Glossary: how to read fuel prices
This note runs with every Fleet Fuel Price Report because these prices measure different things, and a buying decision made off the wrong one is expensive.
- Retail
- The pump price. EIA surveys stations every Monday. It includes federal and state taxes, freight to the station and the retailer’s margin, and it lags the wholesale market by one to two weeks. It is what a fleet pays on a fuel card, and it is the number most news reports quote.
- Wholesale, or spot
- Today’s price for a large lot of fuel at a trading hub: New York Harbor, the Gulf Coast or Los Angeles. EIA publishes it every business day. Rack prices and most supply contracts are set off it, and it is the earliest public signal of where the pump is heading.
- Futures
- A price agreed today for delivery in a future month, traded on the New York Mercantile Exchange. The nearest month tracks spot. The useful part is the shape of the curve: when later months are cheaper than the front month, the market expects today’s tightness to ease; when later months cost more, it expects the opposite. A fleet does not buy futures, but a fixed-price or capped supply contract is priced off them, so the curve is what your supplier is looking at when it quotes one. Futures settlements are published by CME Group and are not free to republish, which is why they are described here rather than charted.
- Bulk
- What a fleet pays a supplier for delivery to its own tanks. It is usually a published rack price, most often OPIS, plus or minus a differential and freight, or spot plus a differential. It excludes station margin, and for state and local governments it usually excludes the 24.4-cent federal excise tax on diesel and the 18.4-cent tax on gasoline, along with state fuel tax where the state exempts government use. Rack prices are proprietary, so there is no public bulk series. The gap between spot and retail is the closest public measure of what a bulk buyer avoids.
- Brent crude
- The price of a barrel of oil from the North Sea, used worldwide as the reference price for crude. Diesel and gasoline are made from crude, so when Brent moves, wholesale fuel follows within days and the pump within weeks. It is quoted in dollars per barrel; a barrel is 42 gallons.
- Energy-equivalent prices
- A gallon of propane, E85 or CNG does not hold a gallon of diesel’s energy, so DOE also states alternative fuel prices per gasoline-gallon equivalent (GGE) and per diesel-gallon equivalent (DGE). That is the price of the same amount of work, and it is the only fair way to compare a CNG or propane quote with a diesel one. The alternative fuels chart in this report uses it.
- What it means for buyers
- Watch spot for direction: a rising spot price this week is a higher pump price next week, and vice versa. Use the curve for planning: when later months are much cheaper, locking in long at today’s price is expensive insurance; when the curve is flat or rising, a fixed-price contract costs less to get. And judge any supplier quote against spot plus freight, never against the pump.
Source: U.S. Energy Information Administration (Sept 2026), Gasoline and Diesel Fuel Update, Spot Prices, Weekly Petroleum Status Report and Short-Term Energy Outlook; U.S. Department of Energy, Alternative Fuel Price Report (April 2026); IRS Publication 510. EIA and DOE data are U.S. government works in the public domain. Charts by Modern Public Fleet from those sources.