Fuel Price Report: Diesel Falls 15 Cents to $6.38 and Still Runs 70% Above Last Year
The week's drop does not fix the budget problem: diesel is $1.37 a gallon above the average public fleets have paid this year, with 13 weeks of buying left.
Retail prices as of Sept. 28 · Wholesale as of Sept. 22 · Short-Term Energy Outlook released Sept. 9 · Alternative fuels for April 2026
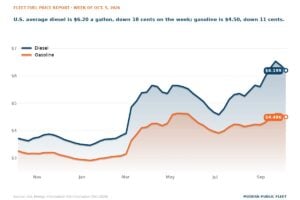
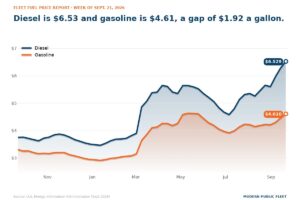
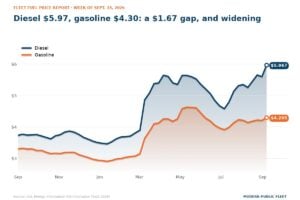
- Diesel: The U.S. average fell 15 cents to $6.38, but it is $2.63 above a year ago, up 70%, and $1.37 above this year’s average of $5.01.
- Gasoline: Nearly unchanged at $4.60, down less than a cent. Diesel costs $1.78 more than gasoline.
- Regions: California diesel is $8.18 and the Gulf Coast is $5.96, a $2.23 spread. The Rocky Mountain region was the only one where diesel rose, up 7 cents to $6.41.
- Bulk buyers: New York Harbor wholesale diesel fell 33 cents to $5.01, more than twice the pump’s drop, leaving a $1.38 gap between wholesale and the national pump price.
- CNG and propane: Per diesel-gallon equivalent, CNG was $3.48 in April against diesel’s $5.55; propane at $5.53 was level with diesel, so its saving rides on the supply contract.
- Why: EIA expects the U.S. diesel stockpile to fall below 100 million barrels in September and stay below the five-year low through much of 2027, and it raised its 2026 retail diesel forecast to $5.07.
The U.S. average price of on-highway diesel fell to $6.382 a gallon in the week ending Sept. 28, down 14.7 cents, EIA said. Gasoline was close to flat at $4.603, down 0.7 cent. Diesel still costs $1.78 more than gasoline and $2.63 more than it did a year ago, a rise of 70%. The week’s drop leaves diesel 15 cents below the year’s high of $6.53 and $1.37 above the year-to-date average of $5.01, which is the number most fuel budgets were built on.
Prices are high because oil is scarce, EIA said. Global oil inventories have fallen by about 400 million barrels this year, and Brent crude, the world oil price that U.S. fuel prices follow, averaged $91 a barrel in August, $7 above July. Brent was $114.89 a barrel on Sept. 22, down $15.91 on the week and well above the roughly $90 average EIA forecast for the second half of 2026 in work finalized Sept. 3. EIA expects Brent to ease to an average of $74 a barrel in 2027 as production rises and inventories rebuild.
Why it is diesel that hurts
Diesel and heating oil, which EIA groups together as distillate fuel oil, are the tight part of the market. In its Sept. 9 Short-Term Energy Outlook, EIA said it expects U.S. distillate inventories to drop below 100 million barrels in September and to stay below the 2021 to 2025 five-year low through much of 2027. Tightness in the world market has pushed domestic prices up and given U.S. exporters a reason to ship more diesel abroad, EIA said. It also assumes world production of the fuel stays below last year’s level in the coming months.
EIA raised its forecast for the refiner margin on diesel, the difference between what a refinery pays for crude and what it gets for the fuel, to $1.57 a gallon for 2026, 21% above the August forecast, and to $1.25 for 2027, 29% higher. It lifted its retail diesel forecast to $5.07 a gallon for 2026 and $4.40 for 2027. Both sit below today’s pump price because they are full-year averages that include cheaper months. One caveat on the weekly picture: EIA discontinued the Weekly Petroleum Status Report highlights summary on Sept. 23. The data tables continue.
If your fuel line was built on this year’s average, re-price the 13 weeks that are left. At $6.38, diesel is $1.37 above the $5.01 year-to-date average. On 100,000 gallons still to buy, that gap is worth about $137,000 more than the budget assumed.
If you have tank capacity and money left in this year’s appropriation, the wholesale drop is worth checking against your rack quote. Wholesale diesel at New York Harbor fell 33 cents to $5.01 on Sept. 22. The trade-off: EIA forecasts retail diesel averaging $4.40 in 2027, so filling every tank now can lock in a price above next year’s expectation, and the biggest one-week rise in the past 52 weeks was 96 cents, so the direction can flip fast.
Where it hurts most
Diesel fell in seven of EIA’s eight regions. California remains the outlier at $8.18, down 7 cents, and the rest of the West Coast is $6.64, down 15 cents. The Central Atlantic is $6.53, down 2 cents, the Midwest is $6.53, down 15 cents, and New England is $6.51, down less than a cent. The Rocky Mountain region was the only one to rise, up 7 cents to $6.41. The cheapest diesel is on the Gulf Coast at $5.96, down 22 cents, and in the Lower Atlantic at $5.95, down 19 cents. California pays $2.23 more than the Lower Atlantic.
Gasoline went the other way in the West. California rose 19 cents to $6.30 and the rest of the West Coast rose 5 cents to $5.26. The Lower Atlantic rose 3 cents to $4.30. Elsewhere it slipped: the Midwest down 9 cents to $4.38, the Gulf Coast down 5 cents to $4.03, the Rocky Mountain region down 3 cents to $4.62, the Central Atlantic down 3 cents to $4.53 and New England down 2 cents to $4.51. For a diesel-heavy fleet, gasoline is the quiet line in the budget this year.
What bulk buyers are paying
Wholesale diesel at New York Harbor, the traded price for barrels delivered there and the benchmark many supply contracts follow, was $5.01 a gallon on Sept. 22, down 33 cents on the week. That is $1.38 below the national pump average. Part of that gap is federal and state tax, delivery and the retailer’s margin, so no buyer captures all of it. A fleet that loads at the rack, the truckload price at a fuel terminal, sees a wholesale move within days. A fleet buying at retail waits for stations to pass it along, and this week the pump moved less than half as far as wholesale did.
If your supply contract prices off a wholesale index, look at the Sept. 22 print before you reset the quarter. Wholesale fell 33 cents to $5.01 while the national pump price fell 15 cents. Contract buyers see that difference first; card buyers see it later, if stations pass it on.
If you buy a meaningful share of your fuel on fuel cards, re-run the bulk math. The gap between the pump and wholesale is $1.38 a gallon, so 50,000 card gallons a quarter sit on the wrong side of about $69,000. Tax, delivery and retail margin are inside that number, so the real saving is smaller, and it only counts if you have tank capacity and the staff to manage it.
The trend: 3, 6 and 9 months
One week does not change the shape of the year. Diesel is up 37% over three months, 18% over six, 82% over nine and 70% over 12. The six-month figure is the smallest because prices had already jumped by late March. Gasoline is up 16%, 12%, 57% and 39% over the same stretches. Wholesale diesel has moved furthest, up 123% over nine months and 113% over 12, against Brent’s 80% and 72%. That points at refining, not crude alone. The largest one-week rise in the past 52 weeks was 96 cents, which is the size of move this market can still make.
CNG, propane and the other fuels
DOE’s Alternative Fuel Price Report for April 2026 prices every fuel per diesel-gallon equivalent, the amount that does the work of one gallon of diesel. CNG was $3.48 against diesel’s $5.55 in the same report, a gap of $2.07. A fleet burning 100,000 diesel-gallon equivalents a year would save about $207,000 at those prices. Propane was $5.53, two cents under diesel, so at retail it is a wash on energy and the saving has to come from the supply contract. LNG was $4.81. B20 was $5.41 and B99/B100 $5.80. E85 was $4.86, above gasoline’s $4.63.
If you are weighing a CNG station, check these gaps against your own quotes. Per diesel-gallon equivalent, CNG beat diesel by $2.61 in the Lower Atlantic, $3.02 against $5.63, and by $3.43 on the West Coast, $3.73 against $7.16. The gap was only $1.00 in New England, $4.55 against $5.55. The trade-off is station capital and the fact that these figures are five months old.
If you run propane buses, the price worth arguing about is the contract, not the pump. At retail, propane was $5.53 per diesel-gallon equivalent against diesel’s $5.55, close enough to call even on energy. The saving, if there is one, is in the supply contract.
What to watch this week, and what it tells you
-
Every weekdayThe New York Harbor wholesale diesel print
It fell 33 cents to $5.01 in the week to Sept. 22. If it keeps falling, pump prices usually follow within a week or two, and contract buyers see it first.
-
Monday, 5 p.m. ETEIA’s weekly pump prices
Watch whether diesel keeps giving back ground or stalls near $6.38. A second weekly decline would be the first back-to-back drop worth writing into a revised budget.
-
Wednesday, 10:30 a.m. ETEIA’s Weekly Petroleum Status Report
The highlights summary was discontinued Sept. 23, but the data tables continue. The number to check is the U.S. diesel stockpile against the 100 million barrel level EIA expects it to fall below.
-
Oct. 6EIA’s next Short-Term Energy Outlook
It will show whether EIA raises its $5.07 retail diesel forecast for 2026 again after Brent traded above its assumed $90 a barrel. EIA’s Winter Fuels Outlook follows Oct. 15.
Glossary: how to read fuel prices
This note runs with every Fleet Fuel Price Report because these prices measure different things, and a buying decision made off the wrong one is expensive.
- Retail
- The pump price. EIA surveys stations every Monday. It includes federal and state taxes, freight to the station and the retailer’s margin, and it lags the wholesale market by one to two weeks. It is what a fleet pays on a fuel card, and it is the number most news reports quote.
- Wholesale, or spot
- Today’s price for a large lot of fuel at a trading hub: New York Harbor, the Gulf Coast or Los Angeles. EIA publishes it every business day. Rack prices and most supply contracts are set off it, and it is the earliest public signal of where the pump is heading.
- Futures
- A price agreed today for delivery in a future month, traded on the New York Mercantile Exchange. The nearest month tracks spot. The useful part is the shape of the curve: when later months are cheaper than the front month, the market expects today’s tightness to ease; when later months cost more, it expects the opposite. A fleet does not buy futures, but a fixed-price or capped supply contract is priced off them, so the curve is what your supplier is looking at when it quotes one. Futures settlements are published by CME Group and are not free to republish, which is why they are described here rather than charted.
- Bulk
- What a fleet pays a supplier for delivery to its own tanks. It is usually a published rack price, most often OPIS, plus or minus a differential and freight, or spot plus a differential. It excludes station margin, and for state and local governments it usually excludes the 24.4-cent federal excise tax on diesel and the 18.4-cent tax on gasoline, along with state fuel tax where the state exempts government use. Rack prices are proprietary, so there is no public bulk series. The gap between spot and retail is the closest public measure of what a bulk buyer avoids.
- Brent crude
- The price of a barrel of oil from the North Sea, used worldwide as the reference price for crude. Diesel and gasoline are made from crude, so when Brent moves, wholesale fuel follows within days and the pump within weeks. It is quoted in dollars per barrel; a barrel is 42 gallons.
- Energy-equivalent prices
- A gallon of propane, E85 or CNG does not hold a gallon of diesel’s energy, so DOE also states alternative fuel prices per gasoline-gallon equivalent (GGE) and per diesel-gallon equivalent (DGE). That is the price of the same amount of work, and it is the only fair way to compare a CNG or propane quote with a diesel one. The alternative fuels chart in this report uses it.
- What it means for buyers
- Watch spot for direction: a rising spot price this week is a higher pump price next week, and vice versa. Use the curve for planning: when later months are much cheaper, locking in long at today’s price is expensive insurance; when the curve is flat or rising, a fixed-price contract costs less to get. And judge any supplier quote against spot plus freight, never against the pump.
Source: U.S. Energy Information Administration (Sept 2026), Gasoline and Diesel Fuel Update, Spot Prices, Weekly Petroleum Status Report and Short-Term Energy Outlook; U.S. Department of Energy, Alternative Fuel Price Report (April 2026); IRS Publication 510. EIA and DOE data are U.S. government works in the public domain. Charts by Modern Public Fleet from those sources.