
Replacement Planning Series: The Aging Fleet Math
Turning your data into a winning replacement equation.
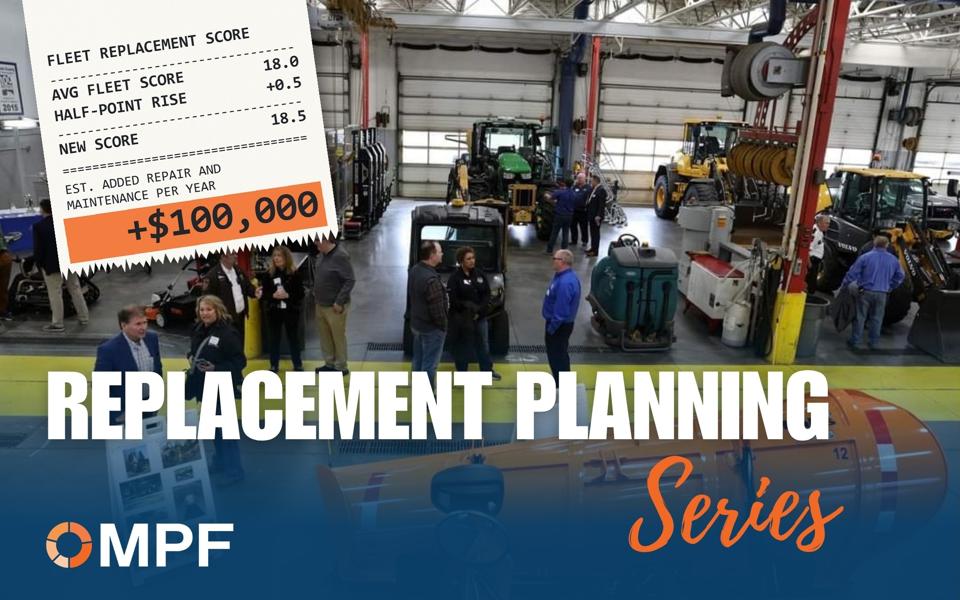
Fleet budgets can bring new meaning to the popular phrase, “The math ain’t mathin’.”
When your presentation to finance doesn’t tell the full story, the numbers won’t add up, and finance will cut or trim your replacement budget. This may make the balance sheet look better, but eventually the savings on paper will be lost in repairs, downtime and lost productivity.
Finance managers may not fully understand the hidden costs of keeping aging vehicles too long. As a fleet manager, it’s your job to show them. When you share the right data, you can turn a replacement case into a winning equation that finance cannot dismiss.

Kevin Schlangen, CPFP, CAFM and CEM Fleet Manager for Dakota County, Minnesota, has discovered that sharing the right metrics visually lands with finance and presents a defensible replacement threshold.
“You have to tell the story behind the numbers,’” he stresses. “Replacement isn’t just about age and miles anymore.”
Examine Total Costs
Years ago, fleets automatically replaced vehicles when they hit a set number of years or miles.
“The decision matrix was when a vehicle hits this many miles or hours or years, we will get rid of it, and we’d budget for that,” Schlangen says. “Decisions were made by a handful of people and were driven solely by acquisition cost. Other operational costs never entered the discussion.”
For a $1 million fleet valuation, that meant a fleet might set aside $1 million annually for replacements. “They just kind of threw mud at the wall because they didn’t have a good way of tracking metrics,” he says. “They could not track vehicles that frequently broke down or identify lemons among newer ones.”
Today, maintenance systems, telematics and other software tools collect lifecycle data that can help fleet leaders evaluate operational costs, reliability and utilization to make informed replacement decisions.
“You can drill down into your actual operational costs,” says the 40-year fleet management veteran. “You can look at things like: How much are you spending on preventative maintenance? How much are you spending on tires? How much do you spend on breakdowns? How much downtime occurs because of those breakdowns?”
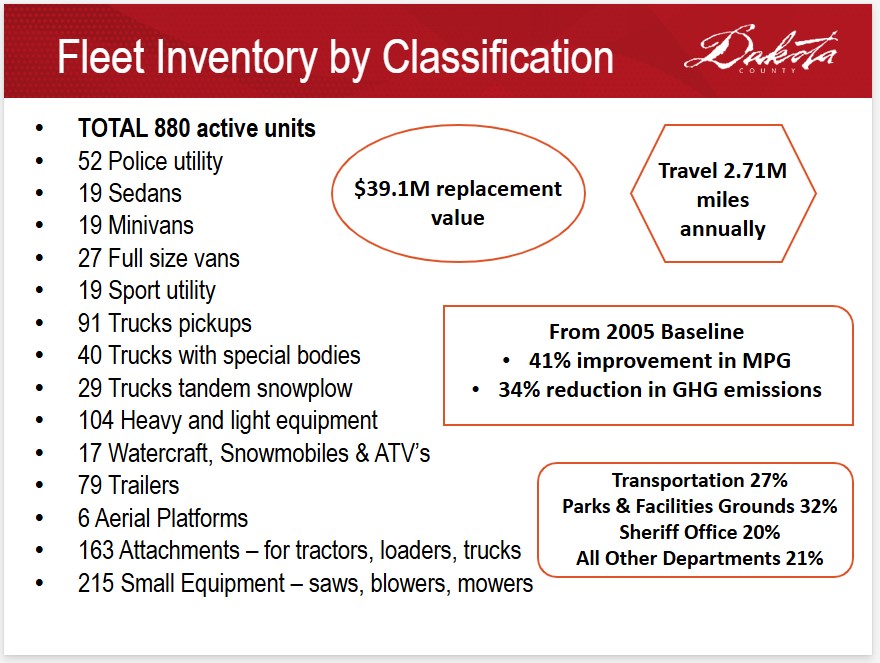
Dakota County has used telematics for over 20 years, giving Schlangen’s team a lengthy history of utilization and maintenance data. This info helps Schlangen present a replacement strategy to county leadership for 880 active assets, including police vehicles, pickup trucks, snowplows, heavy equipment, trailers, watercraft, lifts and 215 pieces of smaller equipment.
 1 / 3
1 / 3Know What to Track
“When you track everything the way we do, it’s possible to have information overload,” Schlangen warns. “You must be able to pick out the data you’re going to use. This allows you to replace intuition with objective, data-driven replacement decisions.”
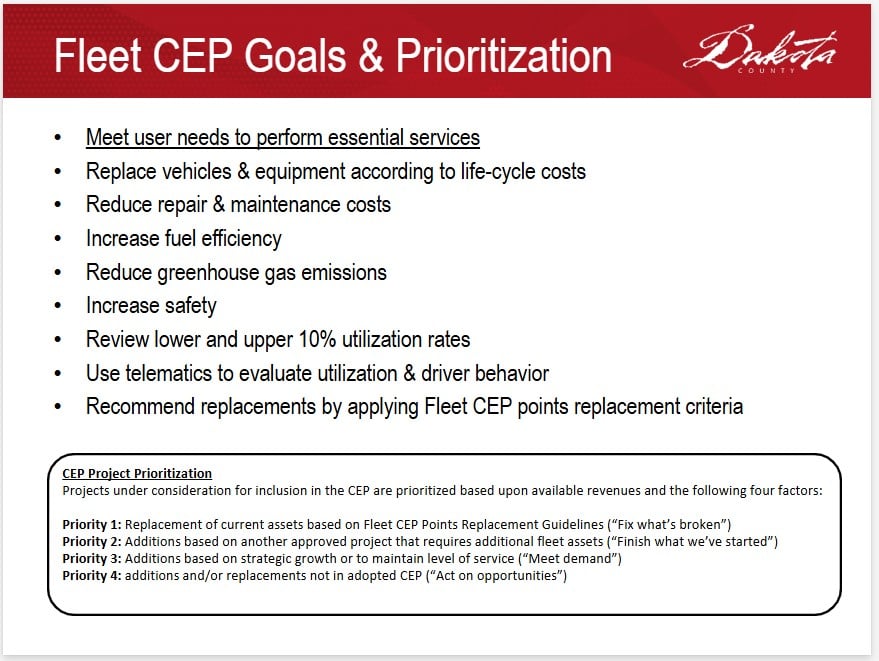
Schlangen sets the fleet’s replacement schedule for Dakota County’s Capital Equipment Program (CEP) by evaluating assets and assigning points to each vehicle in seven categories.
Vehicles can earn points for chronological age, accumulated miles or engine hours. They also can receive more points for their use type, with higher-use assets such as police patrol cars racking up more points than administrative sedans.
Schlangen also evaluates reliability by tracking each vehicle’s completed repair orders over the past 12 months. He also compares lifetime maintenance and repair costs against a vehicle’s original purchase price, and factors in overall condition, including body damage, rust, interior wear, accident history and expected repairs.
Finally, Schlangen awards points for opportunities to improve energy efficiency through right sizing, switching to an electric or hybrid vehicle, or sharing vehicles across departments.
A vehicle’s total points become its cumulative replacement score, which determines the asset’s position in Dakota County’s replacement priority system.
- Under 18 points (Condition I): Excellent condition; replacement is not warranted.
- 18–22 points (Condition II): Good condition; continue monitoring.
- 23–27 points (Condition III): Qualifies for replacement based on lifecycle performance.
- 28 points and above (Condition IV): Needs immediate replacement consideration.
Schlangen says the points system helps him support replacement requests with objective and measurable lifecycle data.
Explain the Data
The rubber really hits the road when Schlangen turns these scores into financial metrics that predict future fleet costs.
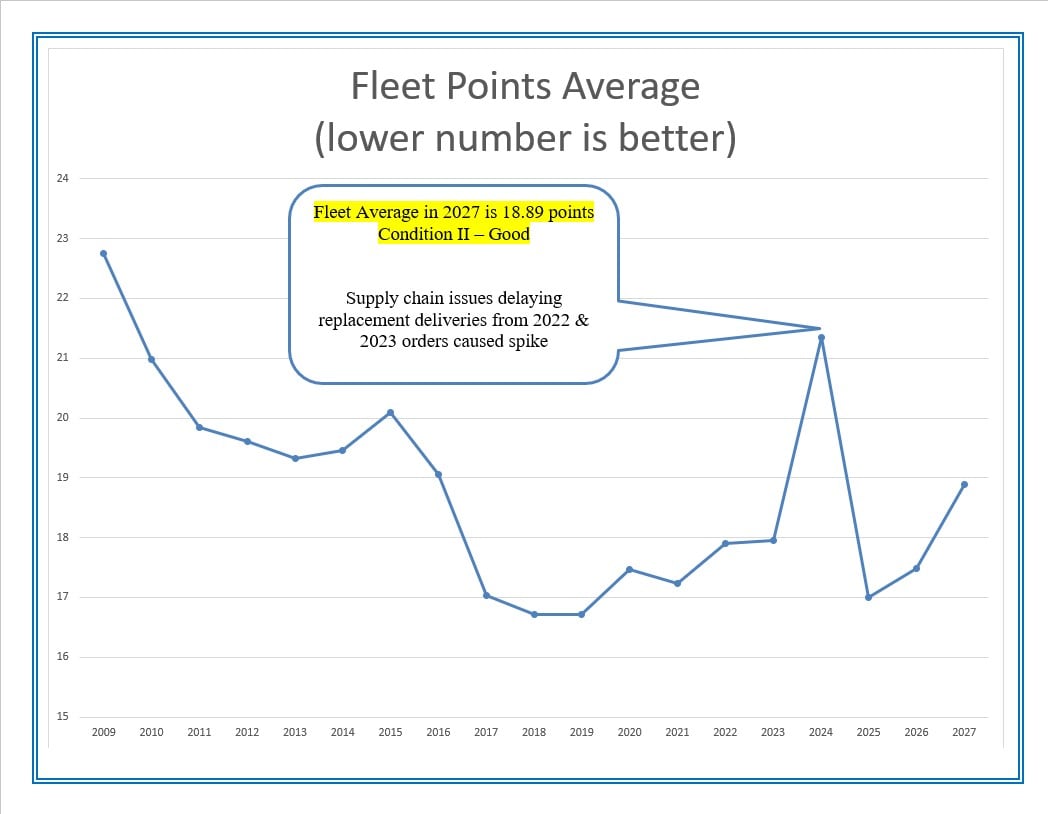
By tracking 85% of its assets (some of the smaller equipment doesn’t fit into the point system), Schlangen can set an average point value for the fleet. For Dakota County that point value is 18.
This average replacement score acts as an early warning system because when the number increases, it shows that the fleet is becoming more expensive to maintain.
“If the fleet’s point value goes up a half a point, to 18.5, we know that the fleet will cost us $100,000 more in repair and maintenance annually,” he says. “If we go up to 19, that’s another $100,000 to maintain a similar level of service and that does not include additional downtime or loss of productivity.”
Schlangen uses this information to support vehicle replacement funding requests.
“They know this is how we do our five-year plan, where our projections are, and that there is a cause and effect to their funding decisions,” he says. “The scoring system helps me translate fleet data into a language finance and elected officials understand. I can say to them, ‘If you cut here, we’re going to spend more money here, and you can expect this loss of productivity here.’ ”
Proven ROI
The point system has helped Schlangen secure funding many times, most recently after the June budget meetings.
Dakota County leadership had asked Schlangen to cut his 2027 budget by nearly $300,000. He used this scoring model and historical cost data to prove that reducing capital funding would increase maintenance expenses and impact productivity.
Once governmental leadership saw the numbers, they quickly restored his budget.
“One county manager said, ‘If we don’t put this back into your budget, it’s going to hurt us in the long run.’ They even restored my training budget,” he says.
Present the Story, Not the Spreadsheet
Schlangen warns against overwhelming decision-makers with excessive data, stressing that the key is to present only the data that matters.
“If you go too far into the weeds, you’re going to lose them,” he explains. “You need to be able to clearly show, ‘This is the cause and effect on our operational budget. This is the cause and effect if you don’t fund our capital budget.’”
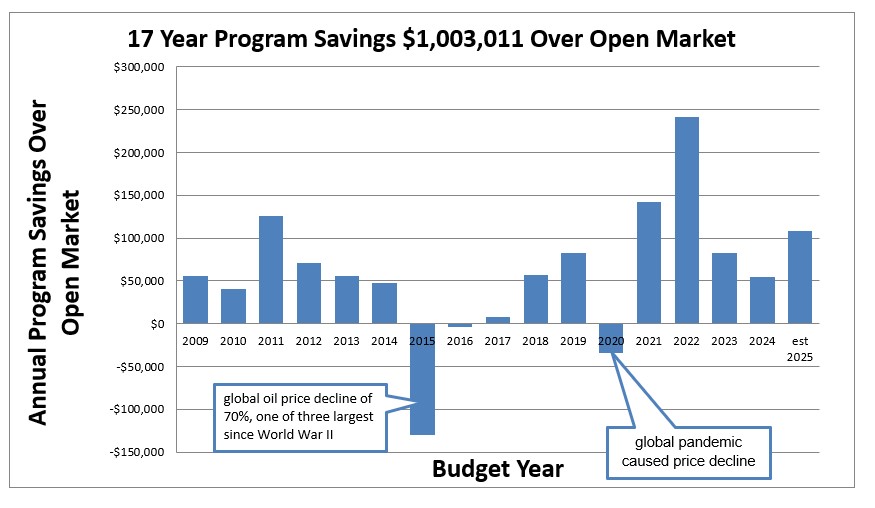
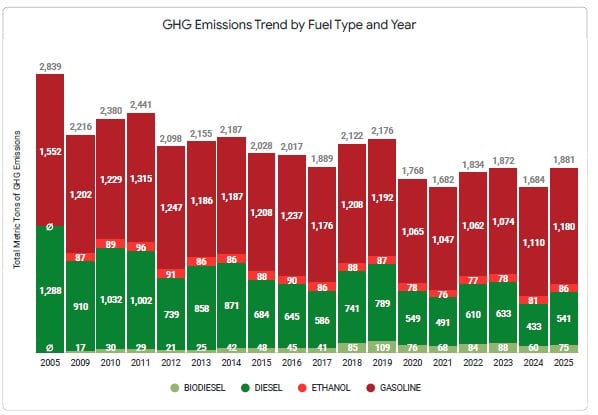
Schlangen shares asset replacement scores, the total fleet score, and the fiscal impact of delaying replacement in three charts that highlight:
- The fleet’s average point score over time,
- Capital funding, and
- Key operational performance indicators.
Together, the charts connect replacement funding to maintenance costs, emergency repairs and staff productivity.
 1 / 3
1 / 3“These visuals illustrate how deferring capital funding drives up operating costs through higher maintenance expenses, more breakdowns and lost productivity,” he says. “If you give them a stack of spreadsheets, they’ll never see the full story. The goal is to make the cause-and-effect relationship immediately obvious.”
Schlangen says that reducing complex lifecycle data to meaningful metrics shifts the conversation from replacing vehicles to managing total cost of ownership.
“The visuals say: ‘This is where we started. This is where the point value was. This is how you funded us, and this is why we haven’t had to raise our other budget requests,’ ” Schlangen explains. “It also says, “If you don’t replace equipment, you’re going to have more emergency repairs and more downtime.’”
Takeaways
Dakota County’s point system and simplified presentations shows financial leaders that there are two sides every replacement decision. Delaying replacement may reduce capital spending today, but it will increase maintenance costs, downtime and lost productivity tomorrow.
The math starts “mathin” when there is quantifiable fleet data that can show that spending more today can save time and money tomorrow.